Admin Training
Masterclass
The definitive 10-chapter guide to mastering GCXONE. From first login and RBAC configuration to advanced AI filtering, enterprise alarm routing, and fleet intelligence.
Choose Your Track
Two paths, one mastery destination
Admin Guide Articles
Deep-reference articles for every admin responsibility area
Platform Overview
Understand what GCXONE is, how it works, and the architectural foundations every administrator must know before configuring the platform.
- ❖ Define GCXONE and its role in modern security operations
- ❖ Describe the entity hierarchy and cascading behaviors
- ❖ Explain how GCXONE integrates with Evalink Talos
- ❖ Identify key AI features and their purpose in reducing false alarms
What is GCXONE?
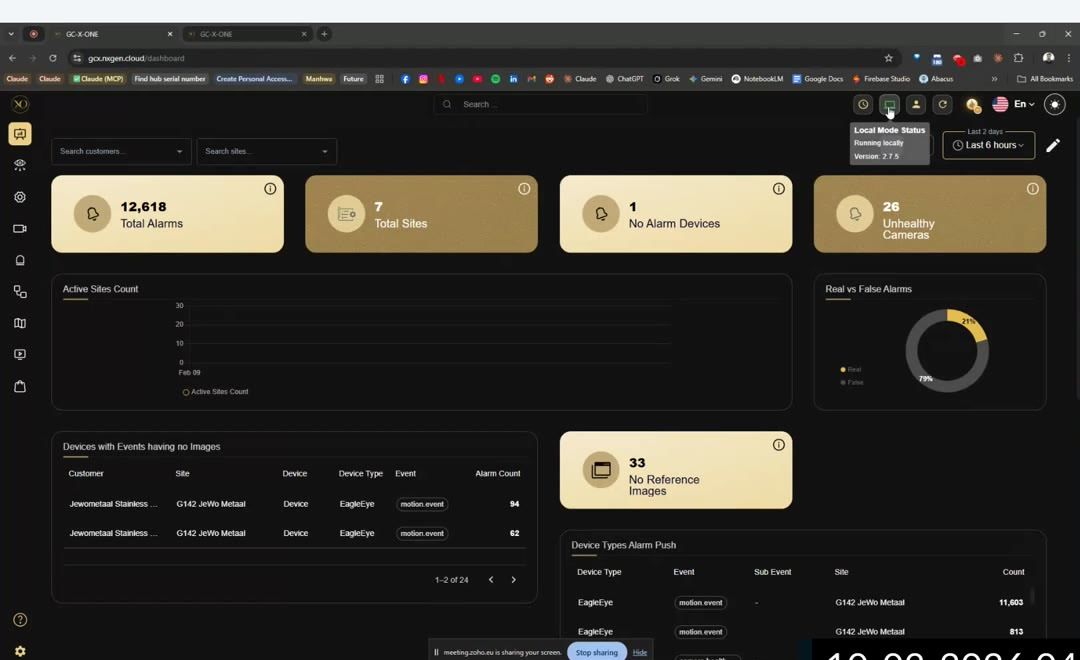
GCXONE is a cloud-based, AI-powered monitoring and operations platform delivering unified video surveillance and IoT services as a Security Management SaaS. It enables centralized remote monitoring without local infrastructure — a single intelligent interface for alarms, device health, dashboards, workflows, and AI tools.
NOVA99x filters up to 99% of false alarms before any alarm reaches an operator.
No local infrastructure. Fully multi-tenant with strict data isolation per organization.
Every user sees only assigned modules, entities, and dashboards — enforced by RBAC.
Onboard hundreds of sites with BulkImport. Grow operations without proportional headcount.
Works hand-in-hand with Evalink Talos as the operator workflow layer for alarm handling.
HealthCheck continuously monitors every camera for offline, obstructed, or degraded states.
The Alarm Lifecycle
Every alarm follows a strictly structured, traceable 5-step lifecycle:
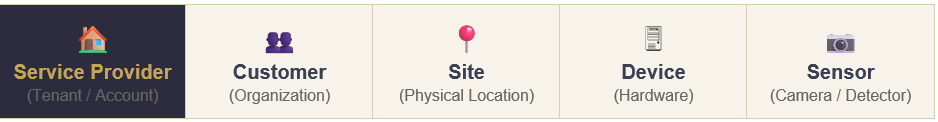
Multi-Tenant Entity Hierarchy
GCXONE vs. Evalink Talos
🔷 GCXONE Side
• Ingests real-time streams from connected fleets
• Runs NOVA99x AI pipelines to reject false alarms
• Empowers operators with live video and playback
• Handles deep configuration across entity hierarchies
🔶 Evalink Talos Side
• Receives scrubbed, verified alarm signals from GCXONE
• Acts as the tactical command layer for operator queues
• Initiates rapid escalation chains and SLA rules
• Enforces "Next Steps" flow charts for crisis resolution
Admin Onboarding & System Setup
Deploy GCXONE from day zero. Covers system requirements, Super Admin initialization, account validation, and establishing the structural framework to operate securely.
- ❖ Validate core pre-deployment networking rules
- ❖ Execute Super Admin initialization gracefully
- ❖ Configure foundational Service Provider metadata
- ❖ Complete the deployment verification pipeline
Browser Requirements
| Browser | Min Version | Status |
|---|---|---|
| Google Chrome | v90+ | Optimal |
| Mozilla Firefox | v88+ | Supported |
| Microsoft Edge | v90+ (Chromium) | Supported |
| Apple Safari | v14+ | Limited |
| Internet Explorer | Any | Blocked |
Firewall & Port Requirements
| Port | Direction | Purpose |
|---|---|---|
| 443 (HTTPS) | Client → Cloud | Core UI, API tunneling, Sanity CDN |
| 554 (RTSP) / 443 | Bidirectional | RTSP streams or WebRTC negotiation |
| 8000 / 80 | Device → Cloud | Hikvision/ISAPI HTTP event nodes |
| DC09 Protocol | GCXONE → CMS | External alarm receiver forwarding |
Super Admin Onboarding Path
Establishing System Architecture
Deployment Validation Checklist
Advanced User & Role Management
A masterclass on GCXONE's Role-Based Access Control (RBAC) doctrine — privilege scaling, entity access overlays, automated inheritance mapping, and specialized SOC role configurations.
- ❖ Differentiate Module Privileges from Entity Boundaries
- ❖ Implement Override and Merge entity logic layers
- ❖ Scaffold roles like Guard, Auditor, and Executive
- ❖ Solve complex access edge-cases efficiently
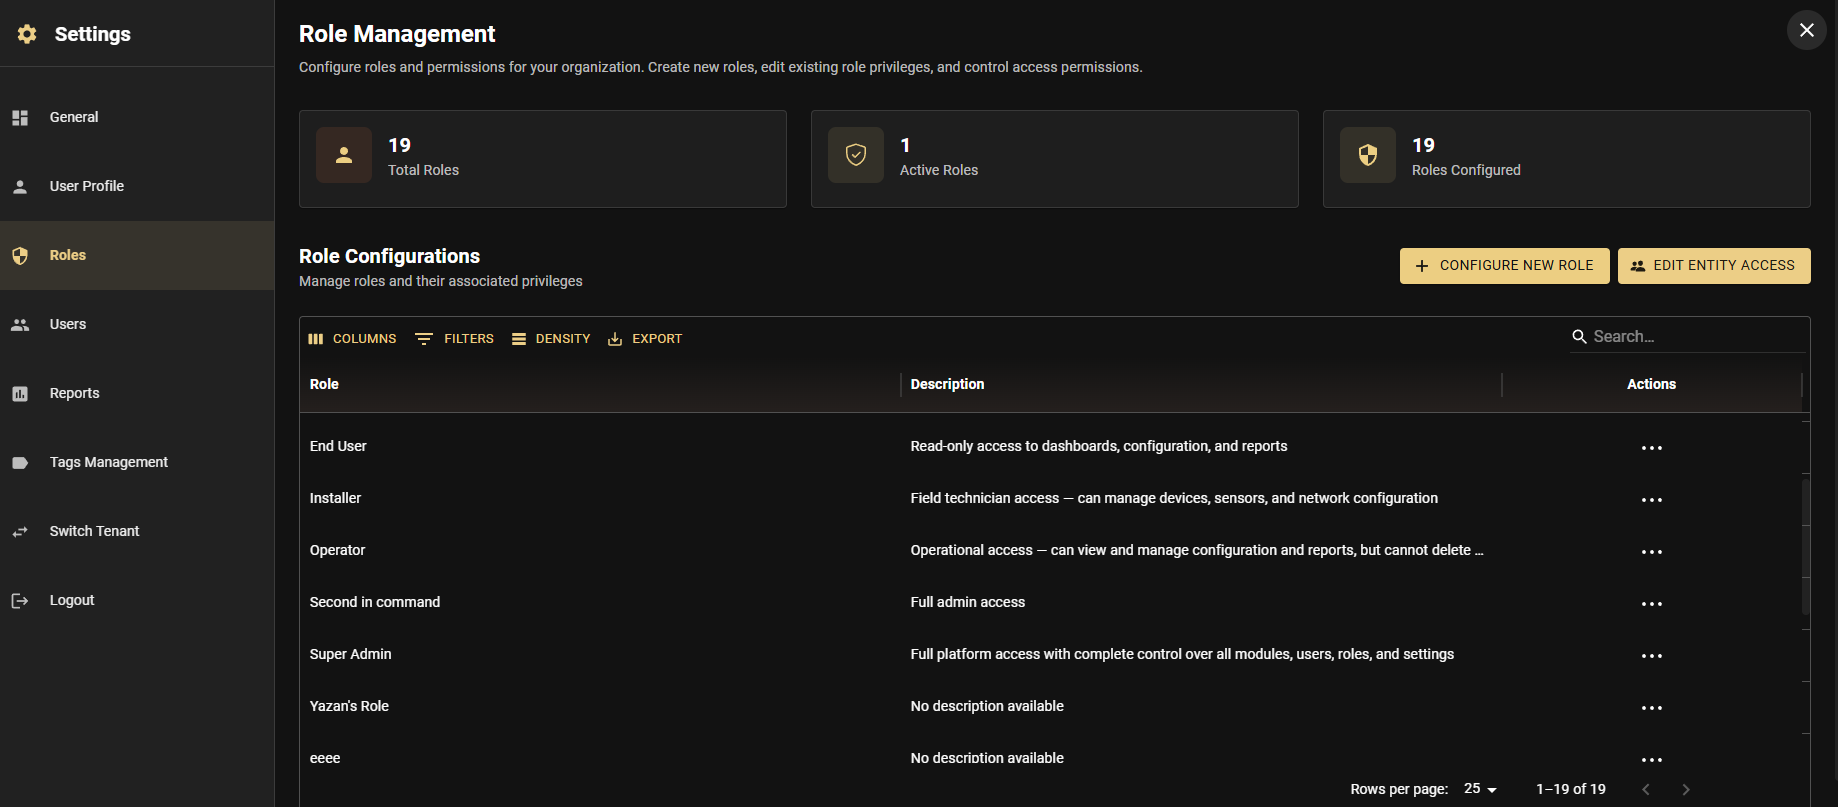
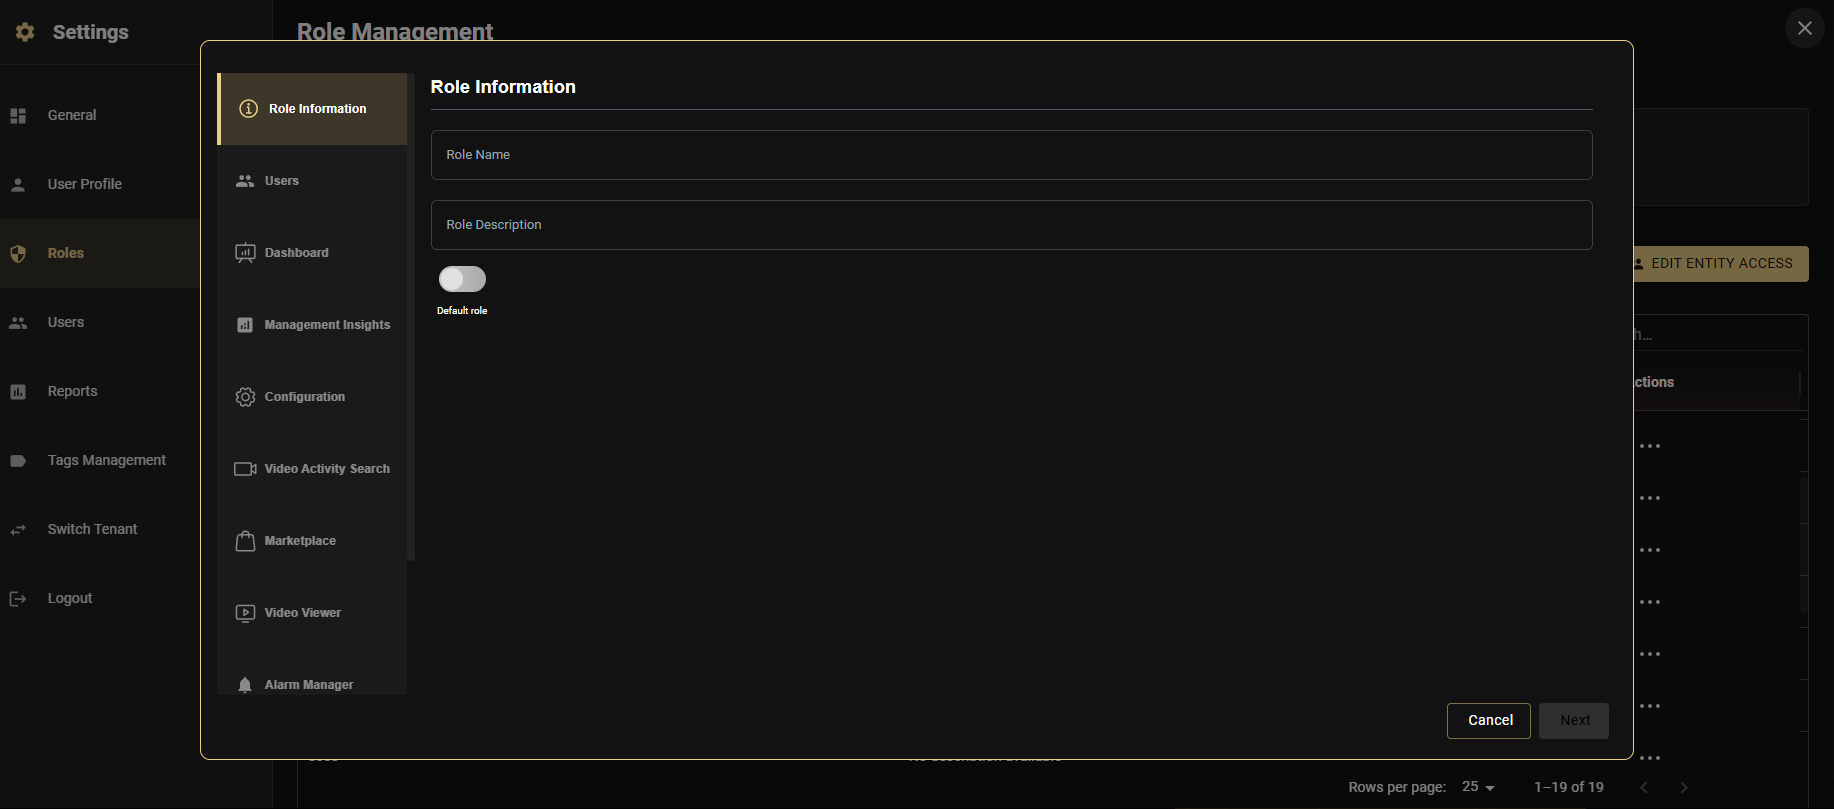
Roles & Permissions
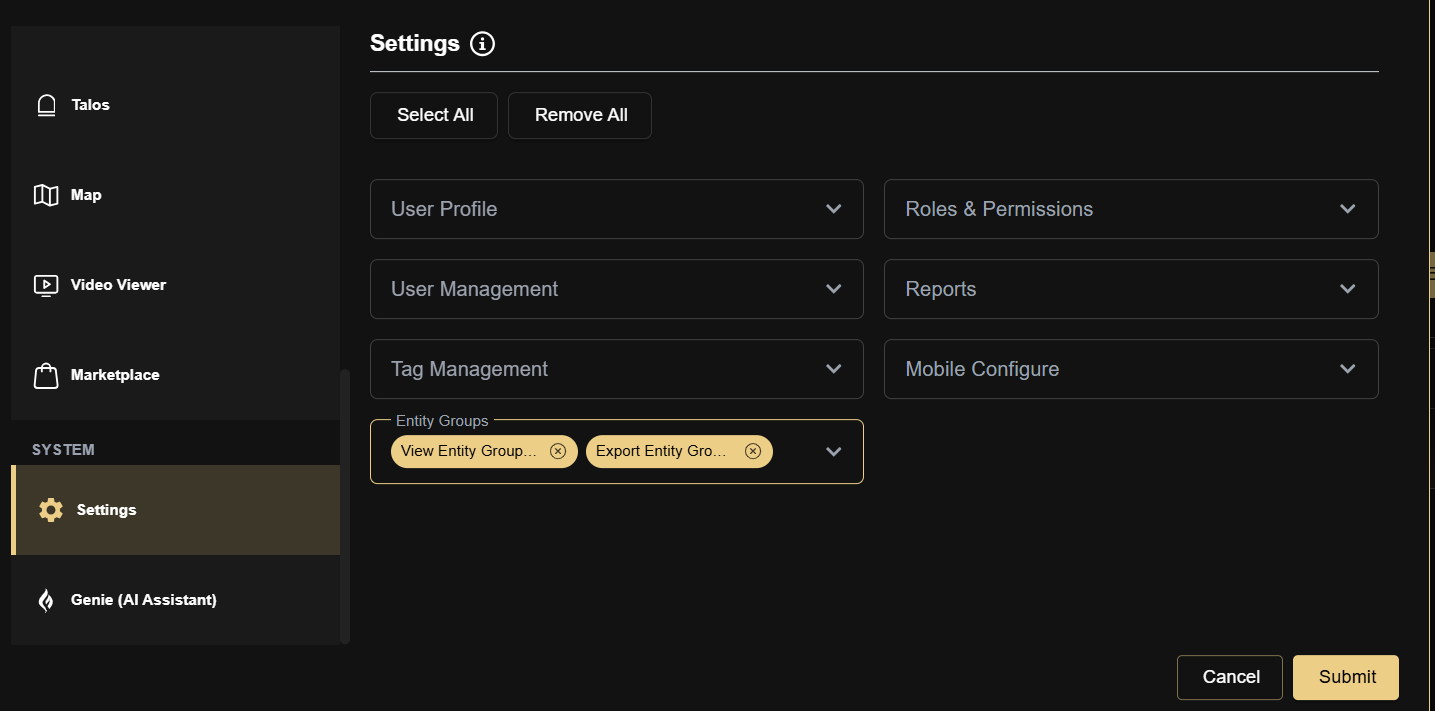
GCXONE uses role-based access control (RBAC) to determine exactly what each user can see and do. Every user must be assigned a role — without one, they land on a blocked screen immediately after login. Roles combine three things: the modules they can access, the actions they can perform within each module, and which customers and sites they can operate on.
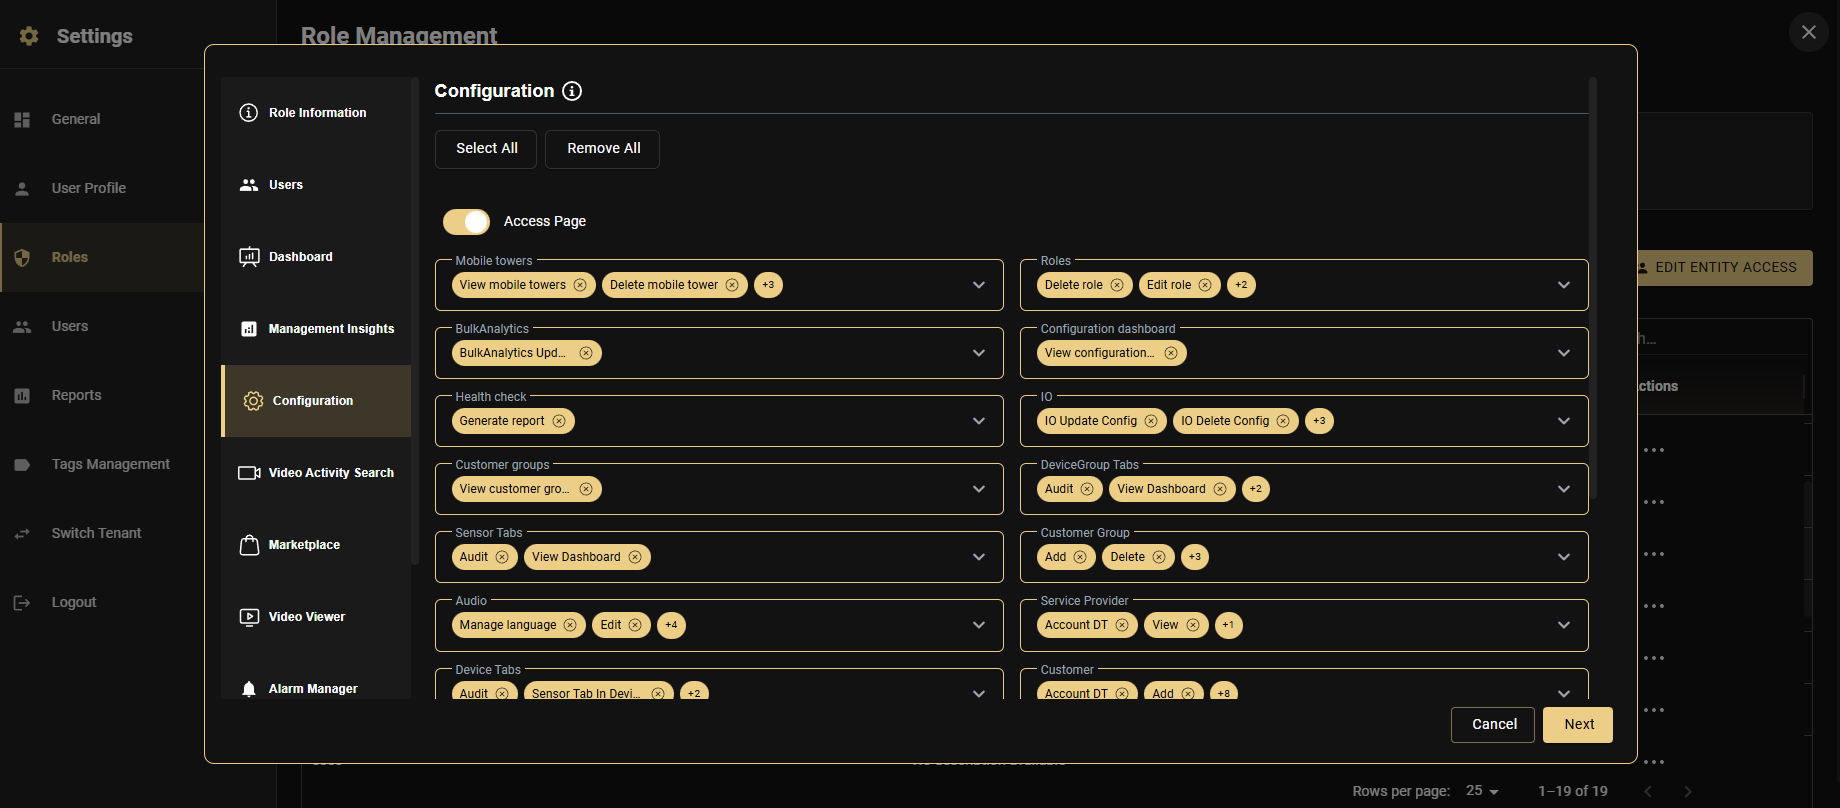
Creating a Custom Role
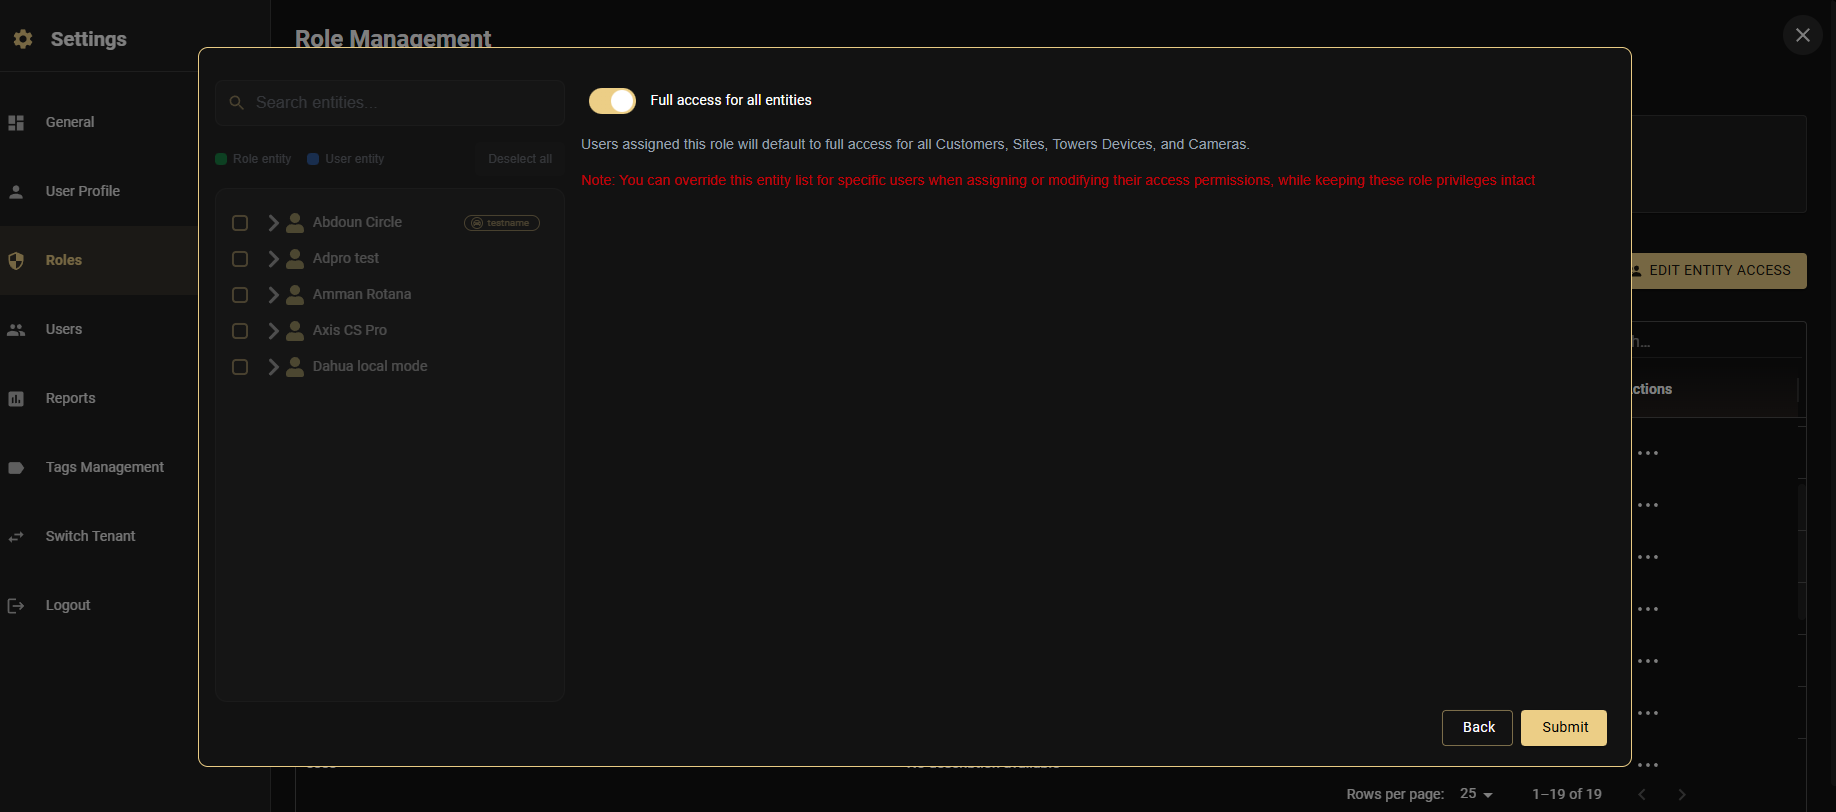
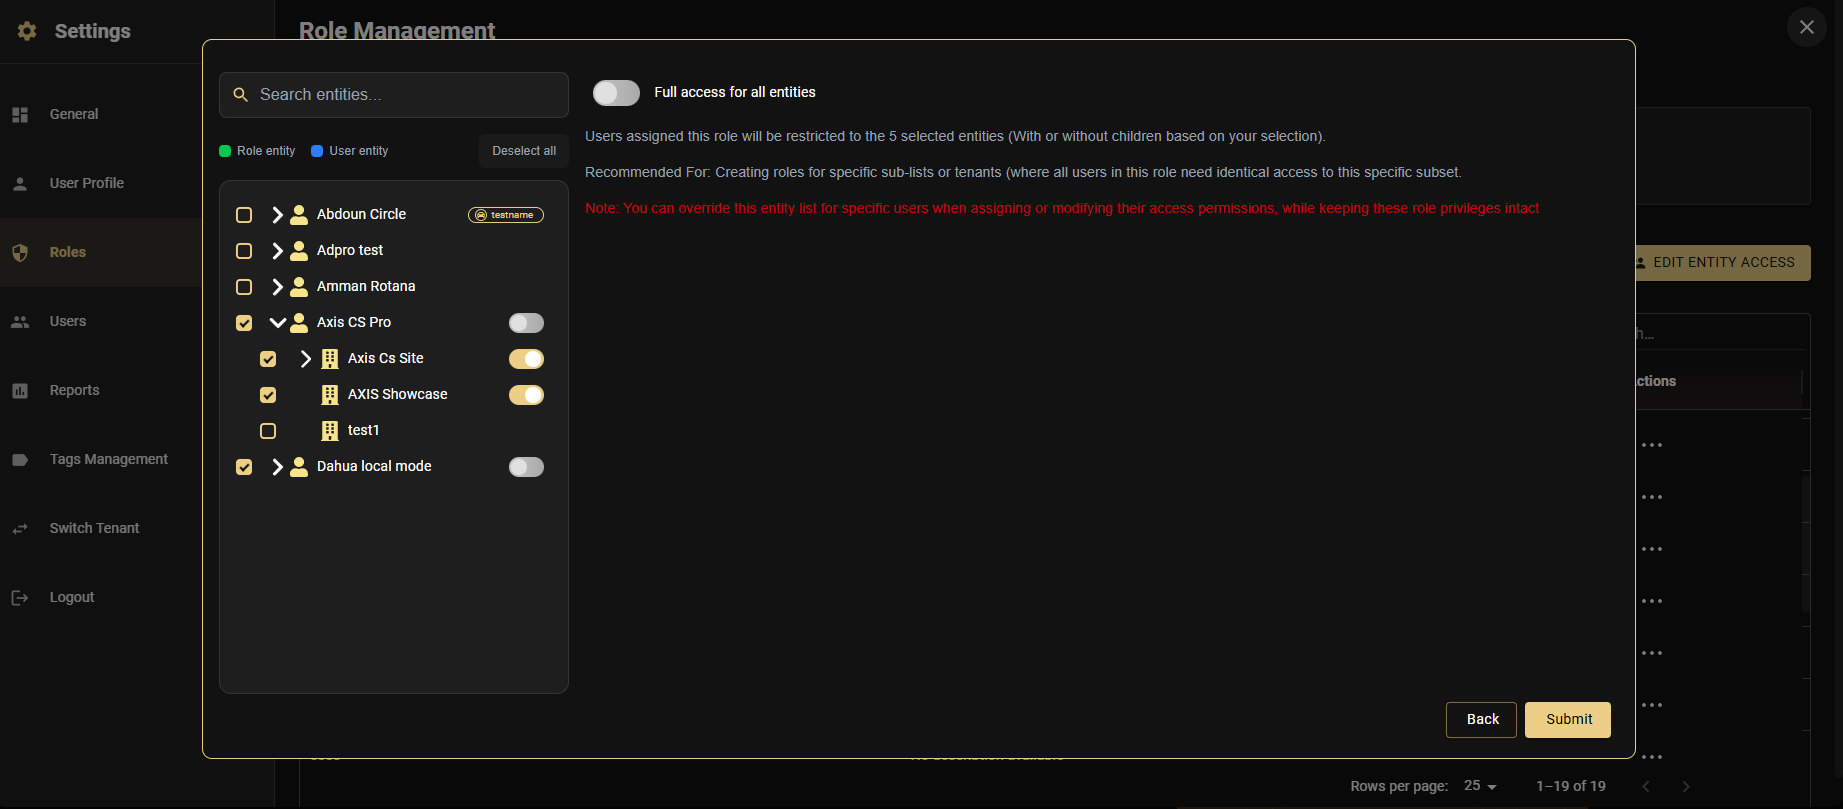
Entity Access — Three Modes
Role Configuration Reference
| Role Type | Enable These Modules | Entity Mode |
|---|---|---|
| Super Admin | All modules | Full Access |
| Admin | Dashboard, Config, Insights, Reports, Marketplace | Full or Selected |
| Operator | Dashboard, Alarm Manager, Video Viewer, Map | Selected Entities |
| Installer | Configuration (Devices), Video Viewer (Live) | Per-site via Override |
| End User | Dashboard, Video Viewer (Live only) | Selected Sites |
| Field Technician | Video Viewer, Alarm Manager (Arm/Disarm), Map | Per-technician Override |
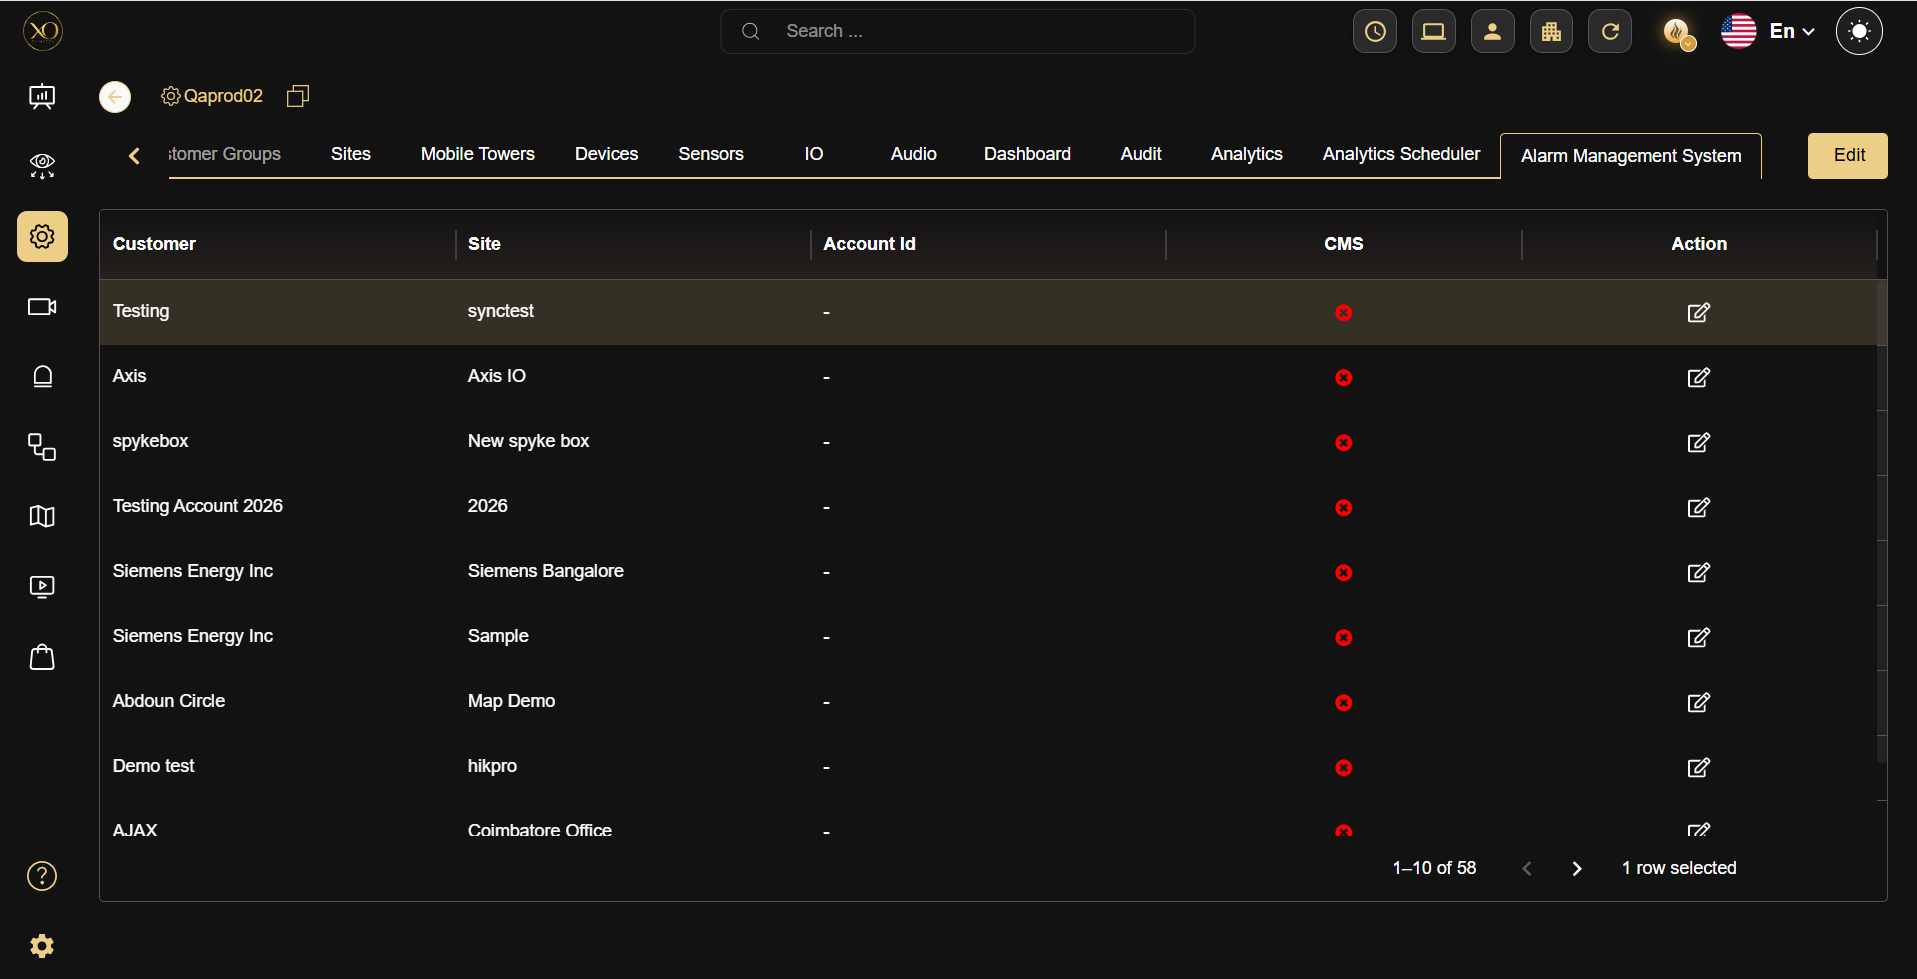
Alarm Management Integration
Configure how verified alarms flow from GCXONE to your Central Monitoring Station — via legacy SIA DC-09 or modern Evalink Talos APIs — and understand the full alarm workflow lifecycle.
- ❖ Configure legacy DC09 CMS integration and handle IP mapping
- ❖ Set up Evalink Talos REST connections
- ❖ Map geographical sites accurately to CMS logical accounts
- ❖ Trace the alarm payload lifecycle from detection to resolution
Industry-standard protocol for IP alarm transmission. GCXONE extends each signal by injecting a secure web link embedding pre-event footage, live feeds, and AI bounding boxes into the CMS browser view.
Cloud-native platform with REST architecture. Achieves bidirectional state synchronization, dynamic operator cueing, and eliminates legacy IP mapping constraints entirely.
Configuring DC09 CMS Integration
Configuring Evalink Talos Integration
Mass Topology Config & Integrations
Master advanced deployment strategies for massive-scale integrations. Leverage BulkImport algorithms, understand bridging mechanisms, and integrate diverse endpoint families effortlessly.
- ❖ Execute massive data transformations using BulkImport spreadsheets
- ❖ Analyse structural device capabilities (NVR, AI Box, Direct Cloud)
- ❖ Interpret and assign streaming transport rules
- ❖ Initiate fully automated cross-platform sync pipelines
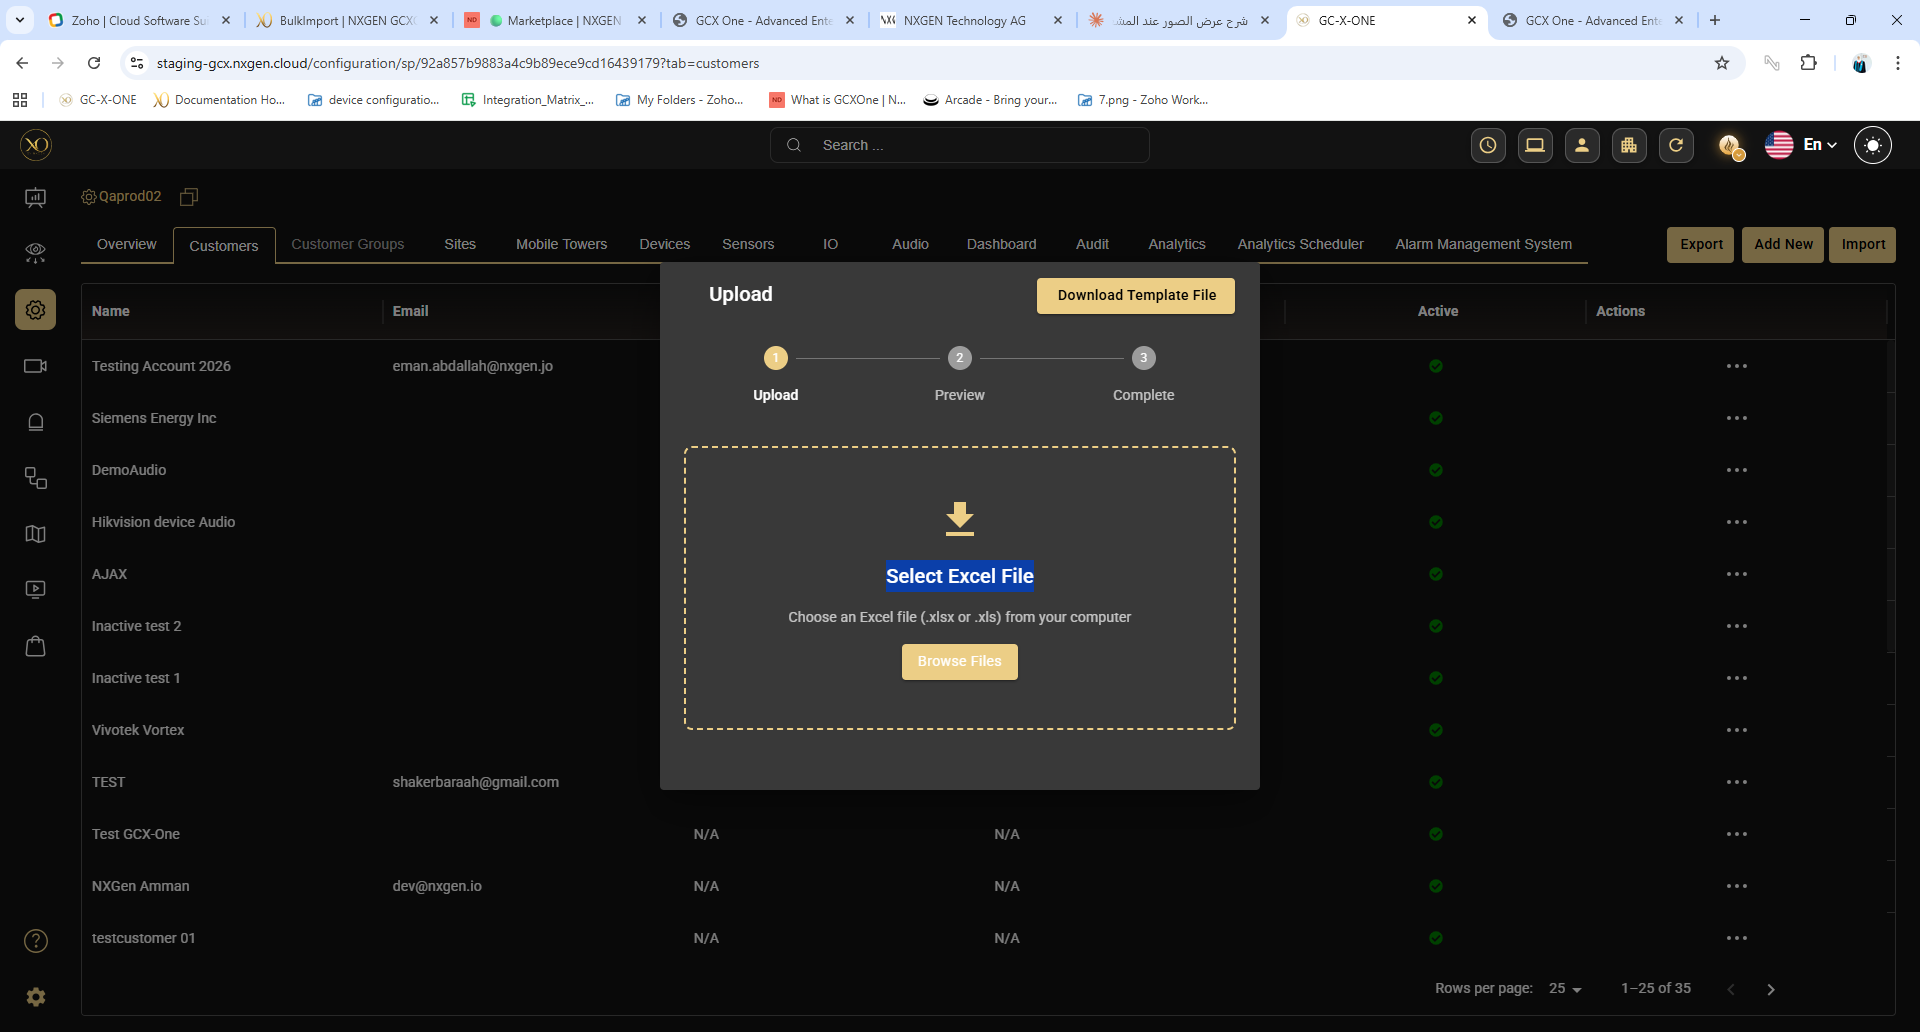
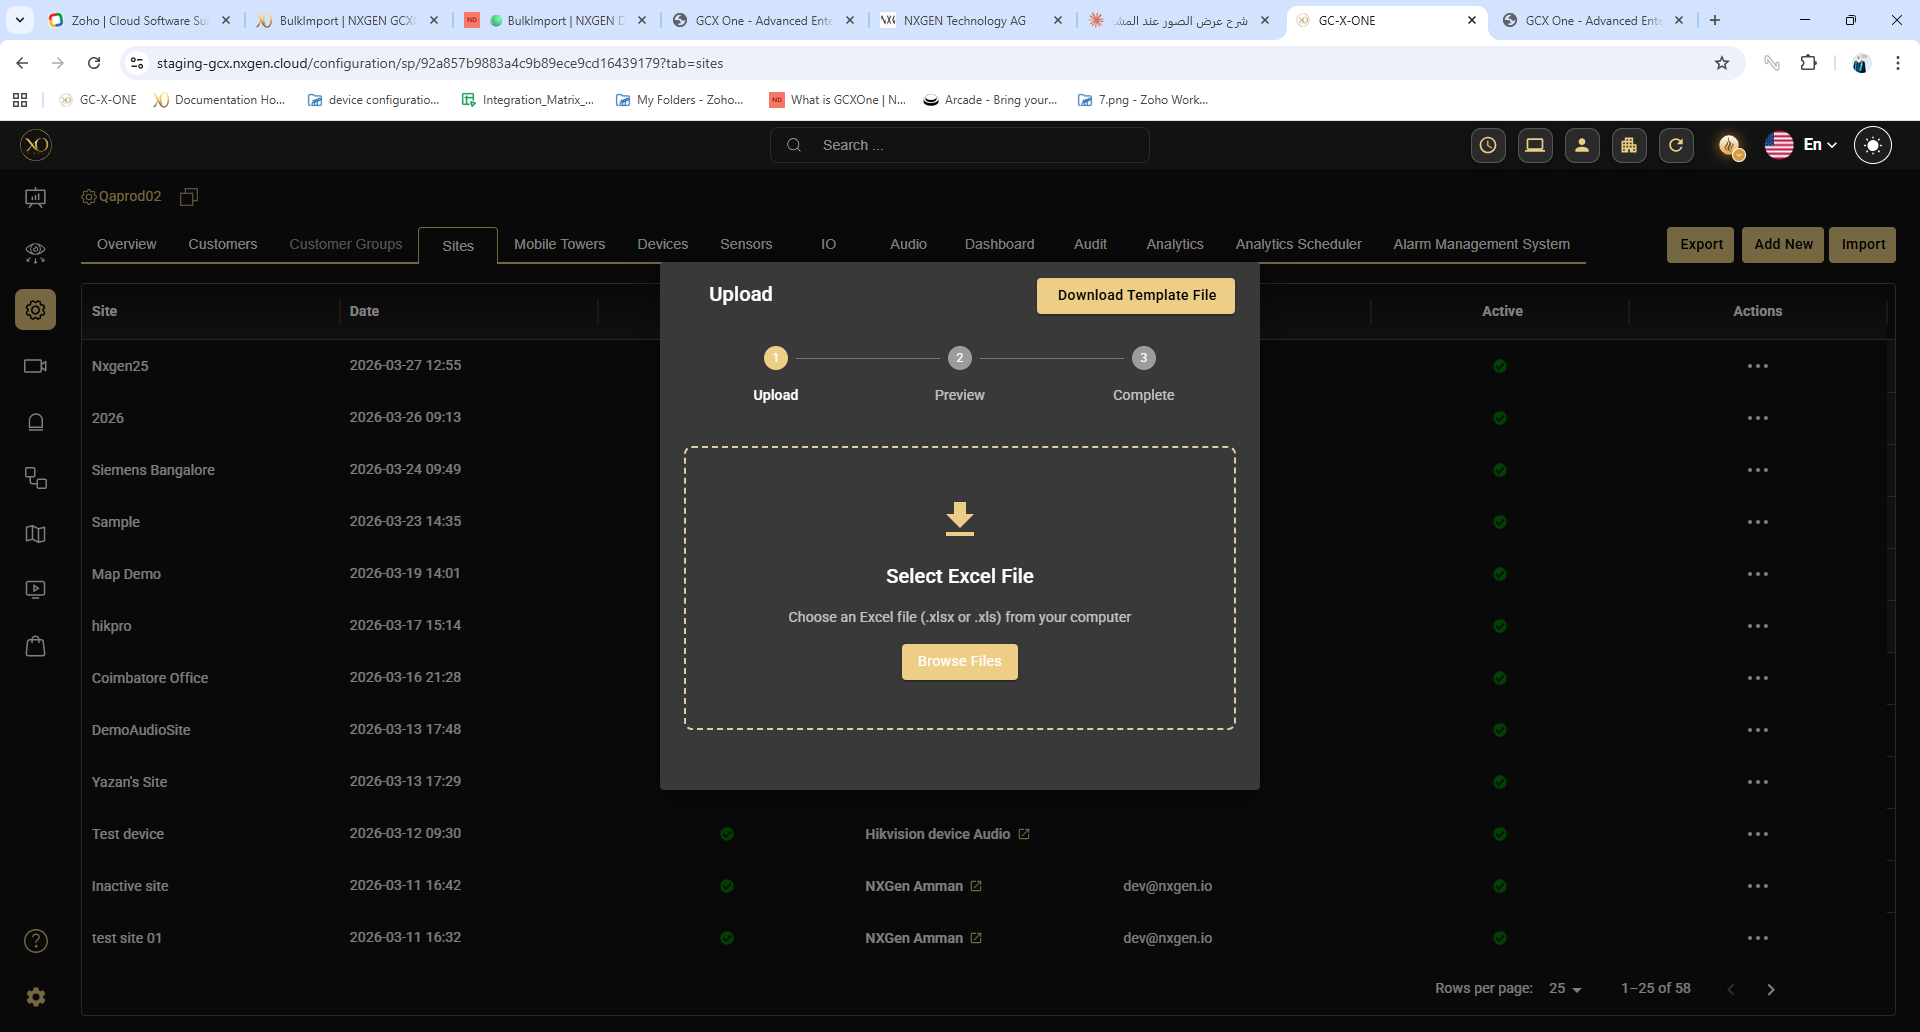
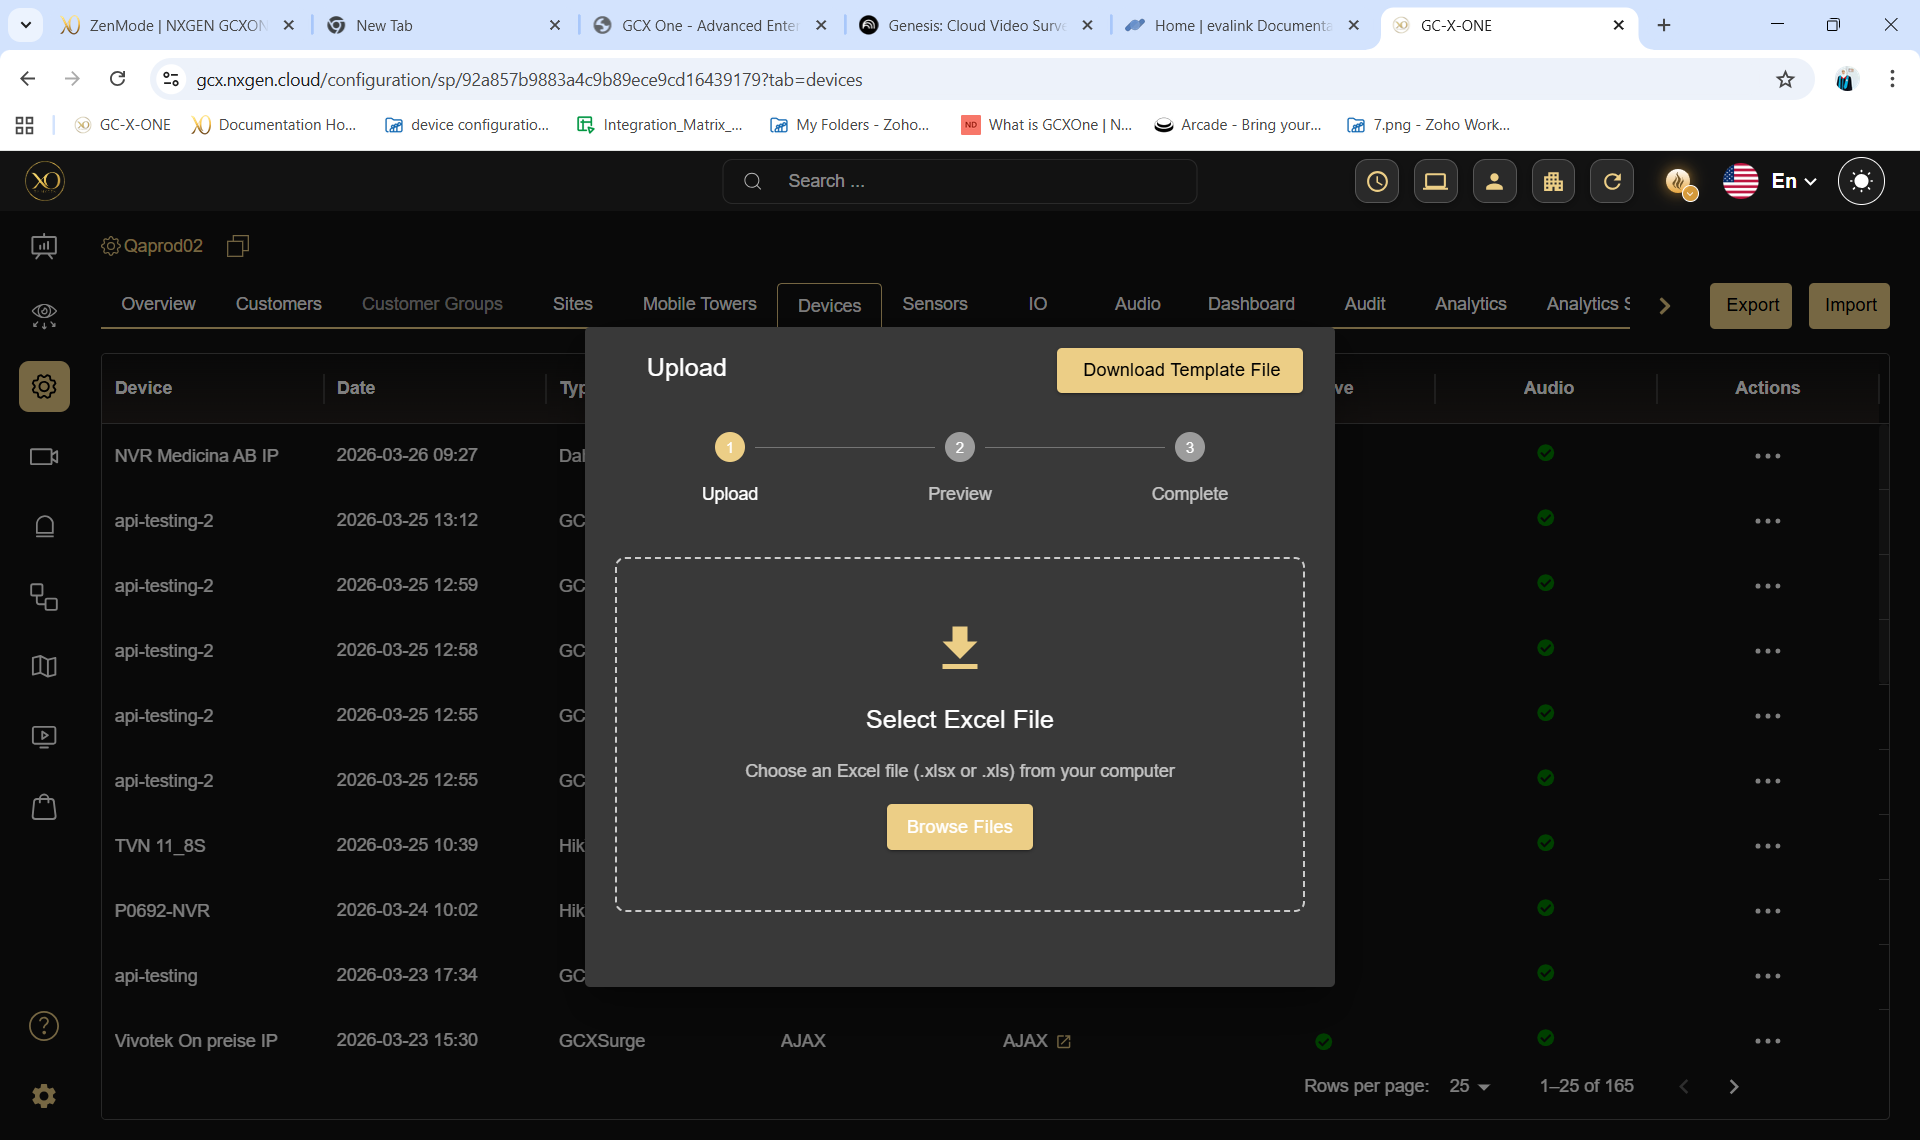
BulkImport Engine
Managing 500+ site conversions manually guarantees human error. BulkImport operates as a deterministic ingestion pipeline validating topology rules via standardised Excel schematics, processing hundreds of devices per minute.
Export the .xlsx template. Map internal databases to the rigid column expectations. Format syntax cleanly.
Upload to initiate the data verification script. It isolates unmapped relational data (e.g. Device → non-existent Site) instantly.
Commit the payload. The database recursively generates Sites, associates Devices, and spins up connection threads simultaneously.
Supported Integrations
Fleet Intelligence & AI Deep Monitoring
Command extreme situational awareness via HealthCheck and NOVA99x AI pipelines. Transition from reactive break-fix to predictive analytical insight driving constant operational efficiency.
- ❖ Analyse the structural mechanics of the HealthCheck probing engine
- ❖ Decipher advanced diagnostic codes and operational states
- ❖ Develop complex reporting vectors for SLA compliance
- ❖ Deconstruct the NOVA99x false-alarm filtering framework
HealthCheck — Granular Fleet Telemetry
HealthCheck runs multi-stage visual and packet verification diagnostics against every camera node simultaneously. It prevents scenarios where cameras silently stream blacked-out matrices while local operators believe coverage is total.
Diagnostic Detection Scope
HealthCheck Subscription Tiers
| Tier | Engine Mechanics | Probe Frequency | Model |
|---|---|---|---|
| Basic Core | Stream viability and basic packet validation | 12-Hour Cycle | Reactive |
| Plus Model | Manual on-demand diagnostics + automated compliance reporting | 15 Min – 4 Hours | Active Professional |
| Advanced AI | Deep neural net image parsing to hunt sabotage anomalies | Granular Variable | Predictive Enterprise |
NOVA99x AI — False Alarm Elimination
NOVA99x is not a filter — it's a multi-layered AI pipeline that evaluates frame data in real time before any alert reaches a human operator. It applies Object Detection, Dynamic Motion Analysis, and Spatial ReID simultaneously to block up to 99% of non-actionable triggers.

Video Matrix & Playback
Configure and manage the high-performance video operations center. Live View matrix configurations, timeline forensic playback, zero-latency PTZ control, and evidence extraction.
- ❖ Build and deploy multi-tenant Live View matrices
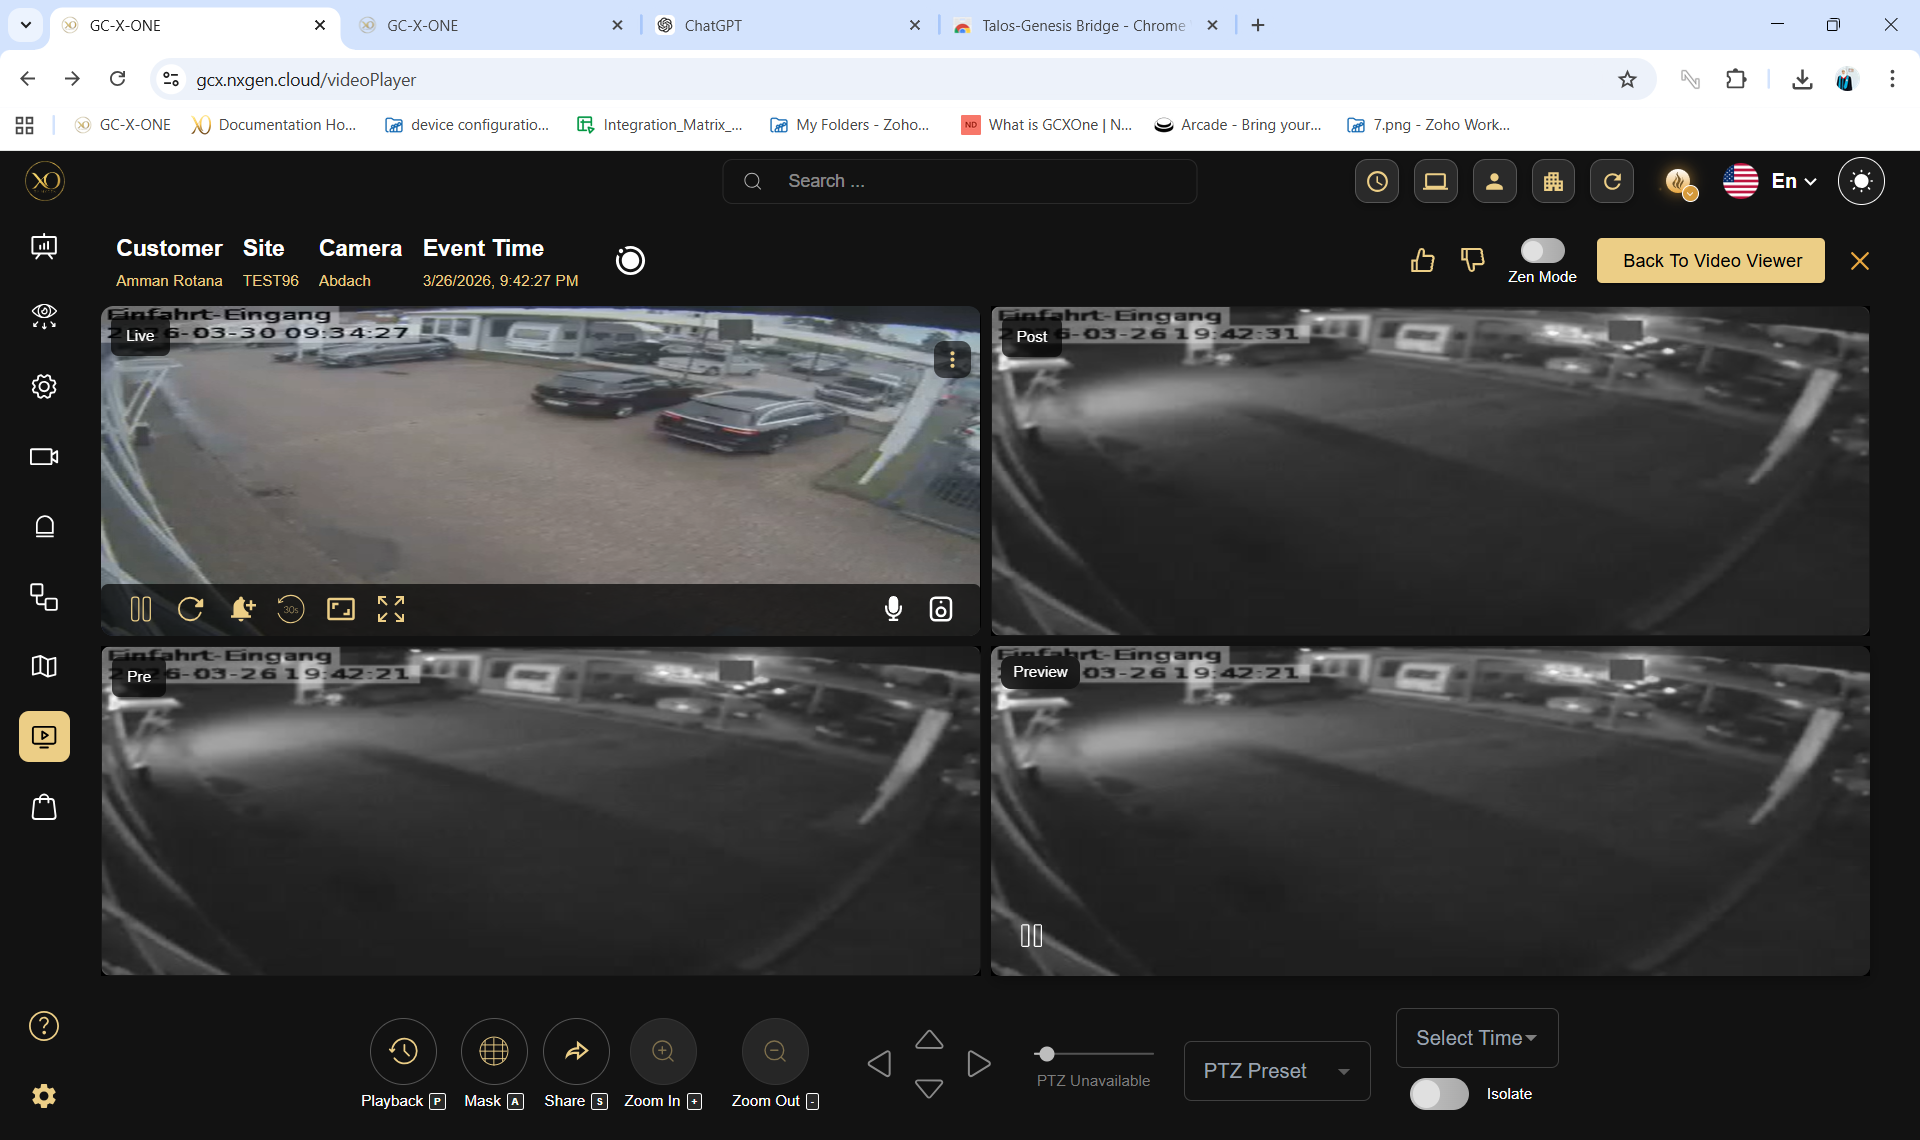
- ❖ Execute forensic playback investigations across mixed vendor hardware
- ❖ Master zero-latency PTZ tracking
- ❖ Deploy Wall Monitor environments for large SOC setups
Live View Matrix Engine
Live View is a high-density, multi-threaded WebRTC matrix capable of rendering simultaneous 4K streams with millisecond latency. Operators build complex situational awareness grids pulling from entirely disparate geographic sites simultaneously.
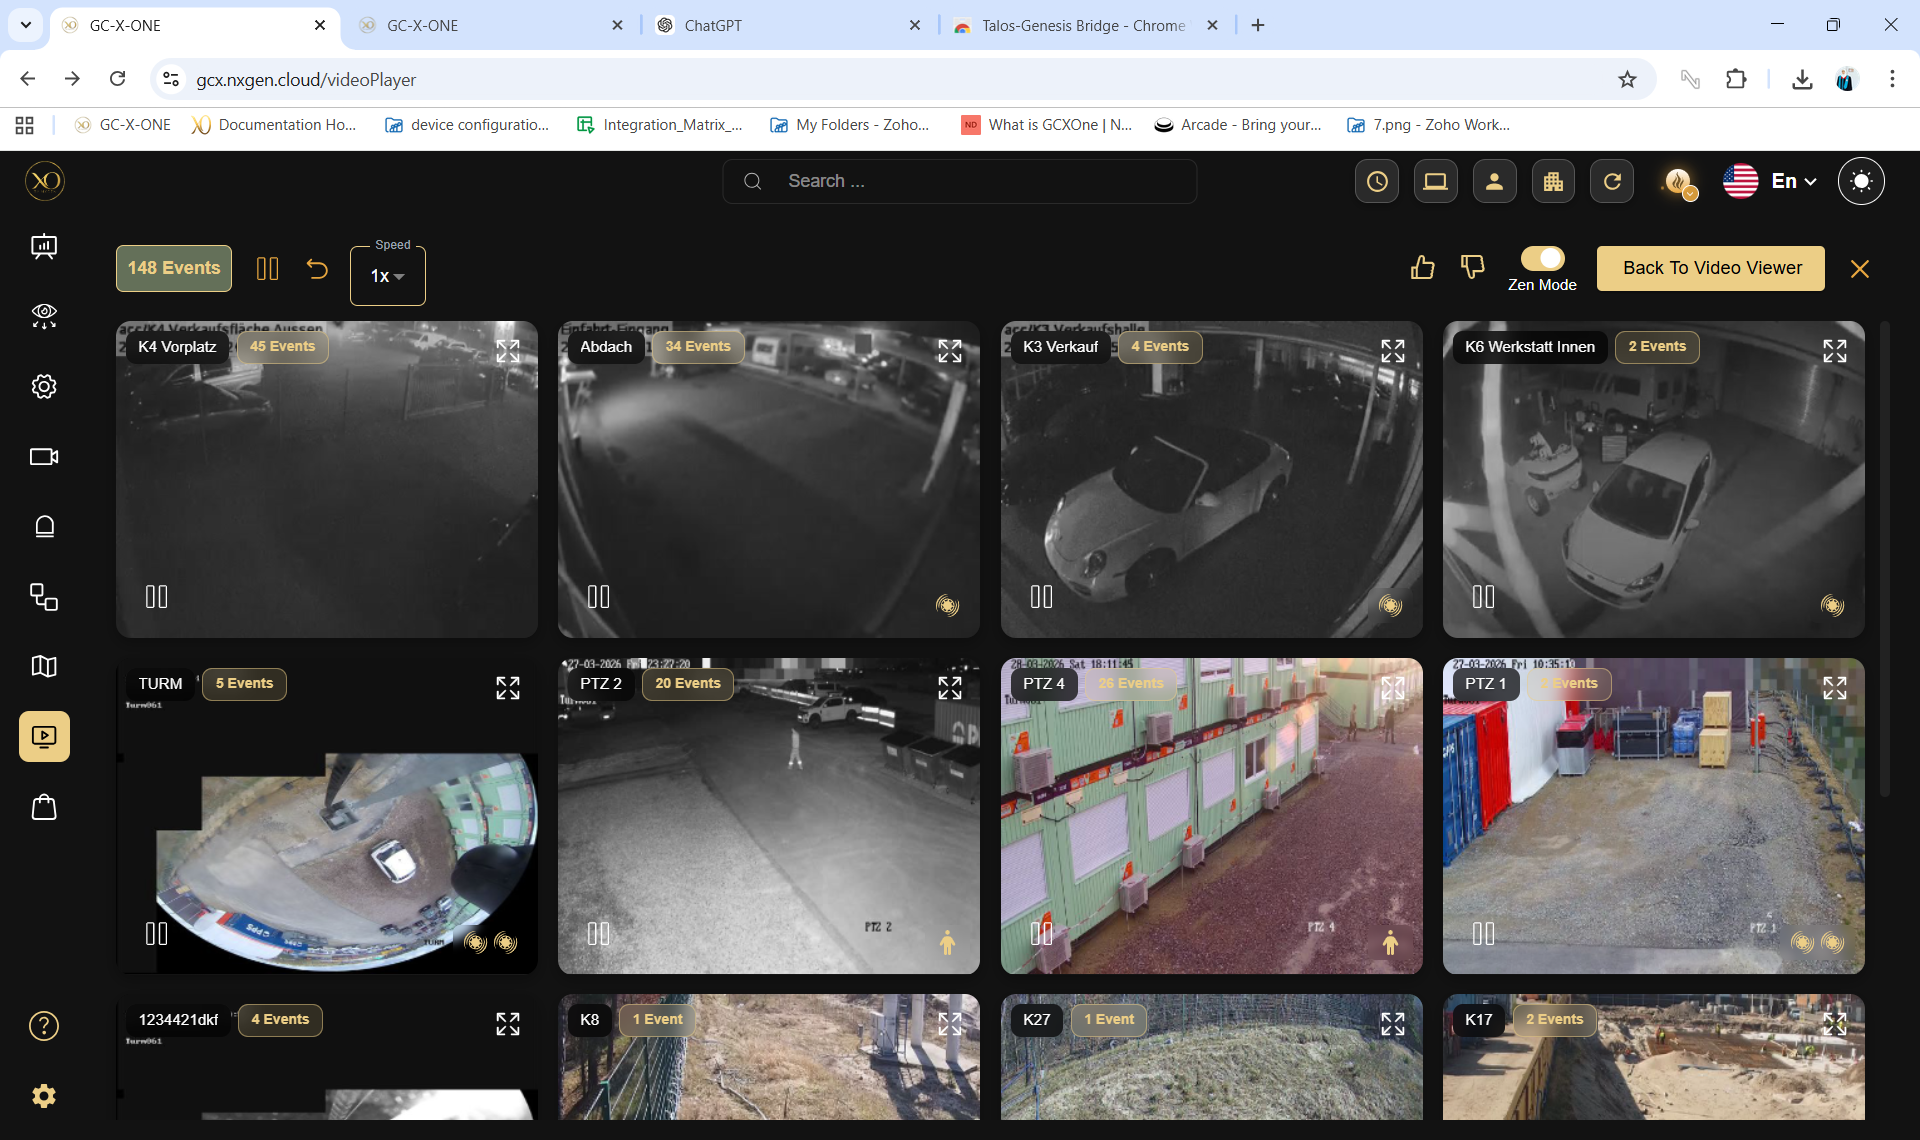
Grid cells auto-reconstruct based on stream aspect ratios (16:9, 4:3, Corridor Mode).
GPU-accelerated region enhancement without moving the physical PTZ.
Save grid matrices. Load "Night Shift North" with one click for 16 specific feeds.
Alarming cameras automatically push to priority focus grids.
Stream Troubleshooting
| Issue | Root Cause | Resolution |
|---|---|---|
| Infinite Spinner | WebRTC / STUN blocked | Whitelist external UDP ports. Fallback to TCP streams. |
| Choppy Frames | I-Frame starvation or bandwidth saturation | Apply AutoStream limits. Force Sub-Stream profiles globally. |
| "No Permission" Error | RBAC entity violation | Grant Video View access to the specific Site in role bindings. |
| Gray Smears | Packet loss over cellular/satellite links | Increase I-Frame interval on edge NVR/Camera UI directly. |
Forensic Playback
Reporting & Analytics
Generate insights, track performance, and deliver scheduled reports to customers and stakeholders using GCXONE's built-in reporting and analytics tools.
- ❖ Use the Operations Dashboard for real-time visibility
- ❖ Access Analytics for performance insights and KPIs
- ❖ Create and schedule automated reports
- ❖ Share reports directly with customers
Real-time global visibility across all customers, sites, and alarm states.
Deep performance metrics: response times, alarm rates, operator efficiency.
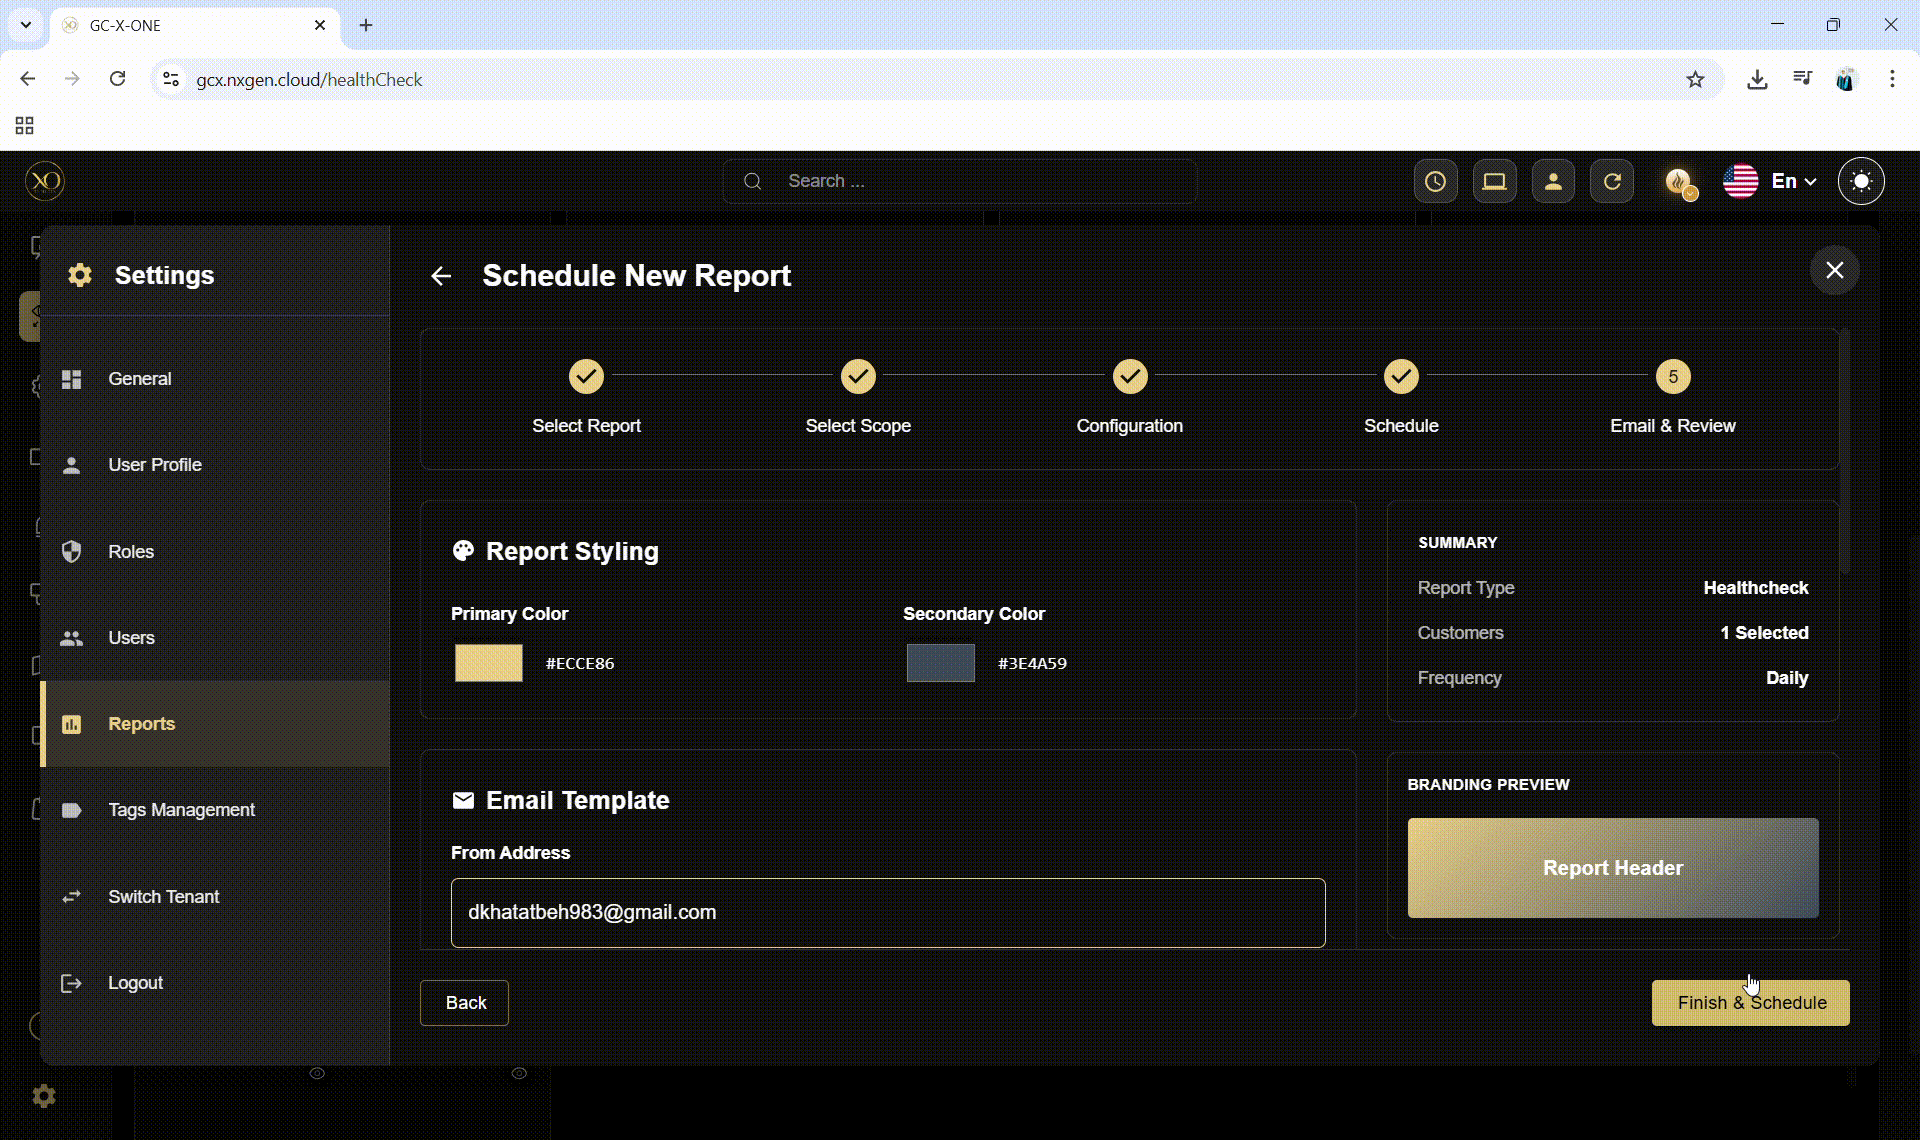
Auto-generate and email PDF/Excel reports on configurable cadences.
Deliver reports directly to customer stakeholders from within GCXONE.
Creating Scheduled Reports
Heat Mapping & Spatial Analytics
Heat Mapping overlays aggregate alarm frequency data onto site floor plans and geographic maps, revealing hotspots requiring camera repositioning, lighting improvements, or additional coverage zones. Invaluable for quarterly customer business reviews.
Operational Tools
Master the operational toolkit — Audit Log for compliance, Maps for spatial awareness, Universal Search for fast navigation, and Tags for intelligent organization.
- ❖ Use the Audit Log for compliance and incident investigation
- ❖ Configure interactive Maps with site overlays
- ❖ Use Universal Search effectively across the platform
- ❖ Organise entities with Tags for operational filtering
Immutable, timestamped record of all significant platform actions for compliance and forensics.
Geographic overlay of sites, live alarm pins, and sensor positions on satellite or floor plan.
Ctrl+K global search across customers, sites, devices, users, and alarms instantly.
Cross-entity tagging enabling powerful filtered views across your entire fleet.
Audit Log Deep Dive
The Audit Log captures every privileged action: user logins, role changes, alarm acknowledgements, configuration edits, and video exports. Each entry is cryptographically sealed with a timestamp, user identity, entity context, and action payload — providing irrefutable forensic evidence.
Universal Search — Ctrl+K
Universal Search is the fastest way to navigate GCXONE. Pressing <kbd>Ctrl+K</kbd> opens a global search overlay that queries customers, sites, devices, users, and recent alarms simultaneously. Administrators managing 1,000+ entities use this as their primary navigation method.
Platform Breakthroughs
Explore GCXONE's advanced feature set — the Marketplace, operational efficiency tools, and specialised modules that differentiate enterprise deployments.
- ❖ Navigate the Marketplace for integrations and automations
- ❖ Use ZenMode for rapid alarm review workflows
- ❖ Configure PulseView for advanced dashboard compositions
- ❖ Understand TowerGuard for mobile/temporary deployments
Eradicate up to 99% of false alarms using computer vision, dynamic motion detection, and spatial ReID. The AI core that makes GCXONE's economics possible.
Predictive fleet telemetry that detects offline cameras, physical sabotage, and visual degradation — automatically and continuously.
Seamless REST API synchronisation with Evalink Talos for dynamic operator cueing and bidirectional state updates.
Immersive full-screen alarm review mode. Rapid-fire alarm queuing with keyboard shortcuts for maximum throughput per operator.
Mobile CCTV tower management module for temporary and rapid-deployment security infrastructure at events or construction sites.
Natural language AI assistant available across all dashboard screens. Query alarms, manage tickets, and spawn bulk actions by conversation.
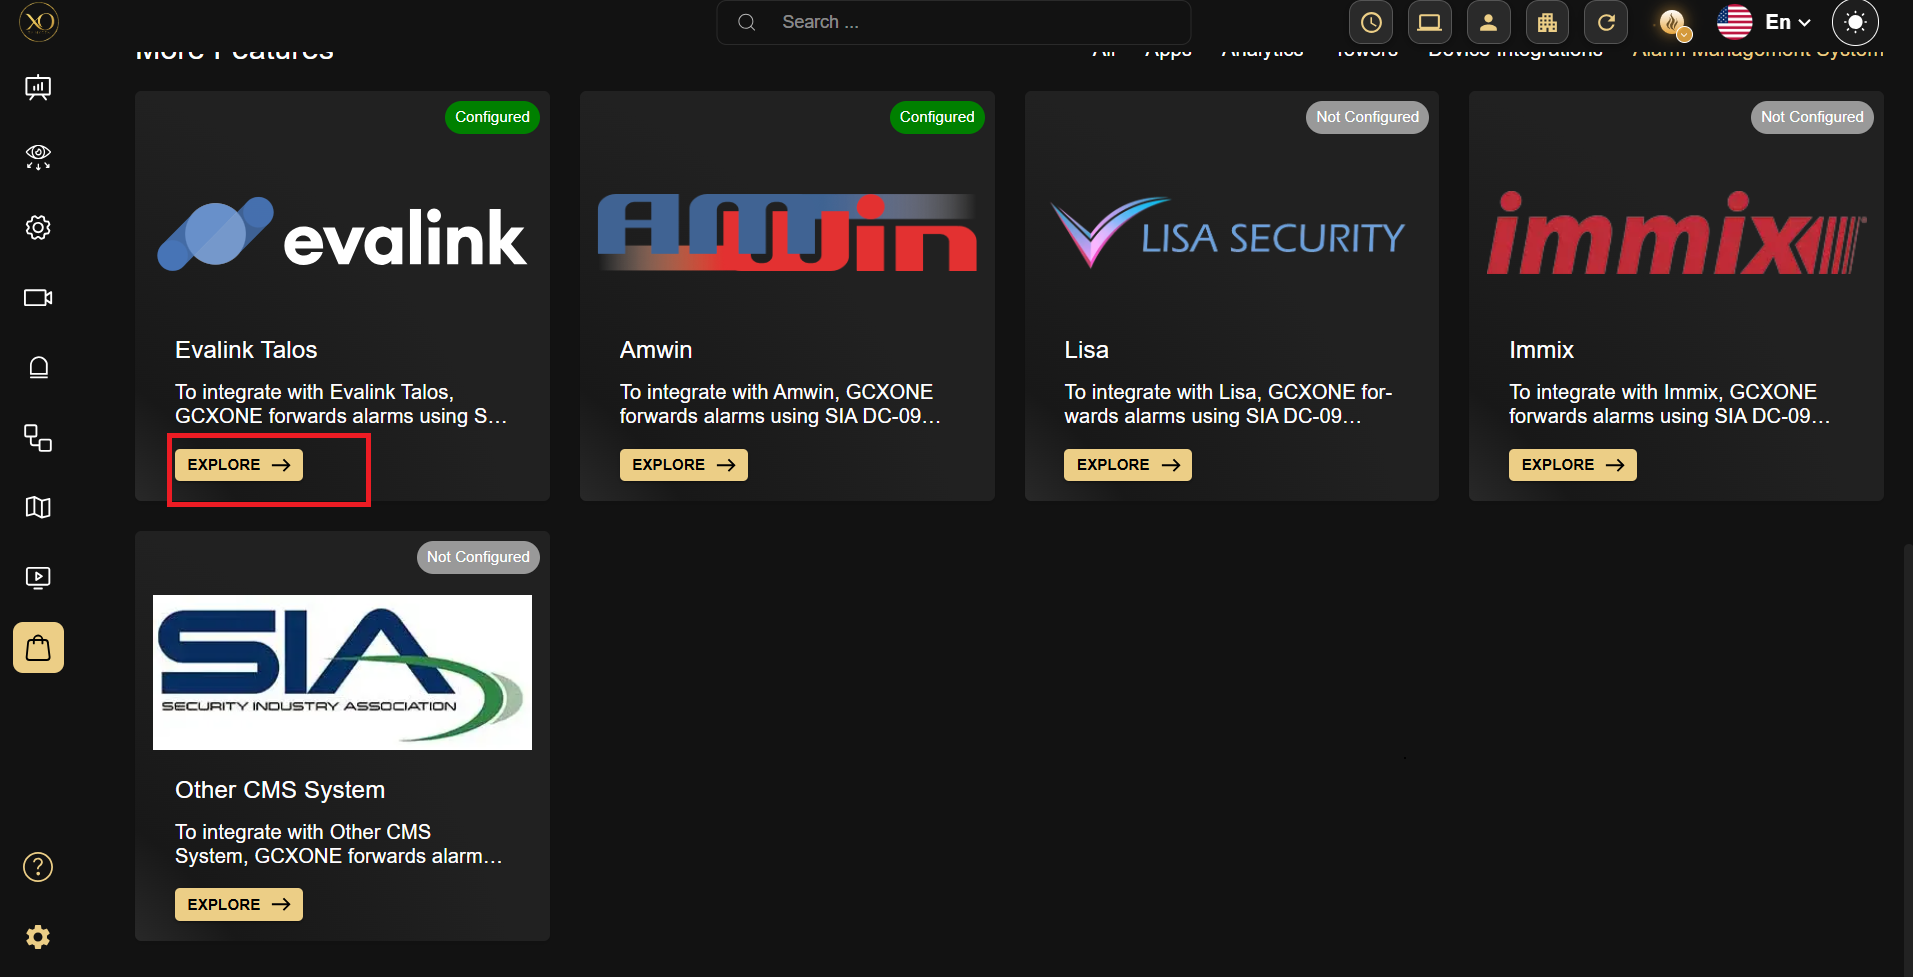
The Marketplace
The GCXONE Marketplace is the central hub for activating integrations, automation plugins, and specialised modules. From alarm management systems (DC09/Talos) to third-party VMS connectors and enterprise SSO configurations — the Marketplace provides a single configuration surface for extending platform capability without custom development.
Quick Reference
Essential navigation paths, role configuration cheat sheets, and the admin go-live checklist.
Navigation Paths — Admin Essentials
| Task | Navigation Path |
|---|---|
| Invite a new user | Settings → Users → Invite New User |
| Create a new role | Settings → Roles → Configure New Role |
| Edit entity access | Settings → Roles → Edit Entity Access |
| Configure DC09 CMS | Marketplace → Alarm Management System → [CMS Name] |
| Configure Talos integration | Marketplace → Alarm Management System → Evalink Talos |
| Map sites to CMS | Alarm Management System → Configuration |
| Enable HealthCheck | Configuration → [Entity] → Analytics Tab → Camera Health Check |
| Schedule a report | Settings → Reports → + Create New Schedule |
| Bulk import customers | Configuration → Customers → Import |
| Bulk import sites | Configuration → Sites → Import |
| Bulk import devices | Configuration → Devices → Import |
| View audit log | Configuration → Audit |
| Open Universal Search | Top Bar → 🔍 or Ctrl+K |
| View HealthCheck dashboard | Left Sidebar → 👁️ (Eye Icon) |
| Switch tenant | Settings → Switch Tenant |
| Resend user invitation | Settings → Users → [User Row] → Resend Invitation |
Go-Live Checklist
Glossary of Terms
Platform terminology used throughout this manual and in the GCXONE interface.
| Term | Definition |
|---|---|
| AMS | Alarm Management System — the GCXONE module that forwards alarms to CMSs via DC09 or Talos. |
| ARC | Alarm Receiving Center — facility that receives and processes alarm signals. |
| Audit Log | Immutable, timestamped record of all significant user actions in the platform. |
| BulkImport | GCXONE feature for mass-onboarding customers, sites, and devices via Excel template. |
| CMS | Central Monitoring Station — facility where operators monitor and respond to alarms. |
| CustomView | User-defined camera layout saving specific camera combinations for quick recall. |
| Customer | An organisation monitored by the Service Provider — second level in entity hierarchy. |
| DC09 | SIA DC-09 — industry-standard protocol for IP alarm signal transmission. |
| Device | Physical hardware connected to GCXONE: NVR, camera, AI box, router, etc. |
| Edit Entity Access | GCXONE interface for customising entity access at the individual user level within a shared role. |
| Entity | Any object in the GCXONE hierarchy: Customer, Site, Device, or Sensor. |
| HealthCheck | GCXONE AI-powered fleet monitoring system detecting camera health issues proactively. |
| Include Children | Hierarchy toggle ensuring child entities automatically inherit parent entity access. |
| Merge | Entity access mode that additively adds entities to existing role access. |
| NOVA99x | GCXONE AI pipeline filtering up to 99% of false alarms before reaching human operators. |
| Override | Entity access mode that completely replaces existing role entity access. |
| RBAC | Role-Based Access Control — GCXONE's dual-axis permission model (privileges + entities). |
| Sensor | The individual physical device: camera, motion detector, etc. — finest hierarchy granularity. |
| Service Provider | Tenant root level — the company operating GCXONE on behalf of its customers. |
| Site | Physical location — third hierarchy level linking to Devices and Sensors. |
| Talos | Evalink Talos — alarm management platform integrated with GCXONE as the operator command layer. |
| TowerGuard | GCXONE module for mobile CCTV tower management in temporary deployments. |
| ZenMode | Full-screen alarm review mode for maximum operator throughput with keyboard shortcuts. |